mint Analytics: Real-time data visualization and analysis in clinical trials with imaging endpoints

We talked to PD Dr. Wolfgang G. Kunz, Head of Oncological Imaging and of the Oncological Study Center at the Ludwig Maximilians University Hospital Munich, about his experience with mint Analytics, an extensive add-on of the leading radiological platform mint Lesion™.

Next to the data visualization of multiple trials, PD Dr. Kunz and his team use mint Analytics for quality control of trial site reads and for sharing the current status of trial results with oncological PIs, which provides them with an estimate of what responses can be clinically expected. PD Dr. Kunz also provides an insight into how mint Analytics has the ability to open up new avenues of single and multicentric research projects and how this can benefit other radiologists, oncologists, imaging CROs as well as sponsors.

Related Resources

Related Resources

Female doctor using technological device. Background shows dots and lines to represent connected data.

Unlocking the Power of AI: The Vital Role of Structured Reporting

We all know the phrase “a picture is worth a thousand words”; yet, in specific fields, one thousand words are simply too many and can potentially…

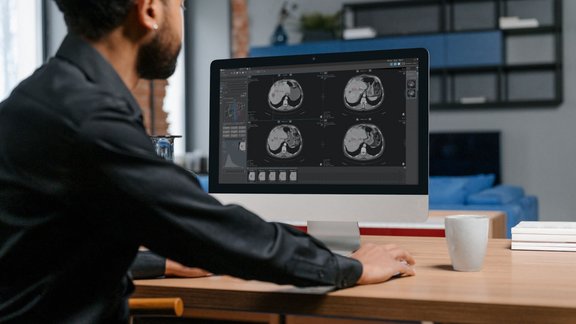
Doctor looking at a CT scan in mint Lesion™

Software-Assisted CT Assessment Outperforms Manual Methods in Oncology Study

A recent study conducted at UKE Hamburg compared manual and software-assisted assessments of computed tomography (CT) scans according to iRECIST…

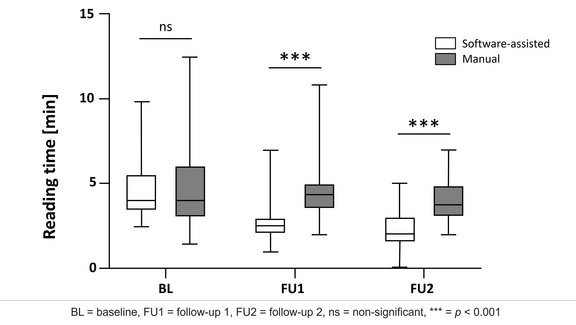
Diagram that shows reduced reading times for the mint Lesion™ approach at both follow-ups.

UKE Hamburg: Study Shows that Software-Assisted Assessments Enhance iRECIST Evaluation

This research study [1] aimed to compare the feasibility and reliability of manual versus software-assisted assessments of computed tomography (CT)…